|
簡體中文|
English| Launch:2024-01-03 |
1. Research background
Recently, with the full release of COVID-19 epidemic prevention and control, enhance the immune capacity of the body, effectively fight the virus, everyone's enthusiasm for vitamin C supplement is unprecedented. Honey lemonade, honey grapefruit tea and other epidemic prevention drinks have become popular in moments. As a nutrient, honey has many health benefits, such as regulating immunity and intestinal microorganisms, antibacterial, anti-inflammatory, antioxidant and so on.
Honey refers to the natural sweet substances produced by bees, such as collecting plant nectar or plant living secretions or sucking insect excreta from honey sources on plants, and mixed with their own secreted unique substances. After transformation, deposition, dehydration, storage and retention in the honeycomb until maturity [1]. The price of honey is greatly affected by plants and geographical sources. In order to ensure food safety and ensure the stability of the honey market, the identification of honey species is very important. In traditional methods, sensory detection is manual, and the results are greatly affected by factors such as honey storage conditions [2]. Based on this, the market needs to develop simple and rapid detection methods.
2. Raman spectrum test of honey from different plant sources
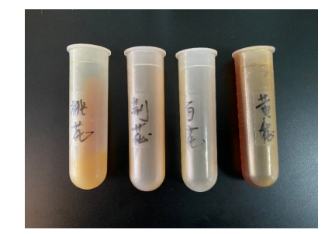
Picture 1:4 Honey from plants
Raman spectrum acquisition
Fix the RMS1000 on the bracket, put a small amount of honey on the aluminum foil, place it on the sample carrier platform, and fine-tune the distance between the probe and the sample to make the laser focus on the sample. The spectral acquisition parameters are as follows:
Laser power: choose different power according to different honey, generally 200~400mw.
Integration time: choose different integration time according to different honey, generally 800~1000ms.
The average number of spectra was 5.
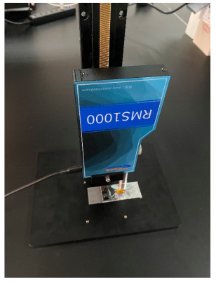
Figure 2: Raman spectrum acquisition process
Data processing of Raman spectroscopy
Spectral preprocessing method: spectral smoothing, selecting the spectral range of 300 cm to 1600 cm, deducting spectral baseline, and normalizing the maximum value. The preprocessed Raman spectrum data were analyzed by principal component analysis, including 10 flowers, 7 flowers, 10 flowers and 9 peach blossoms
3.The experimental results
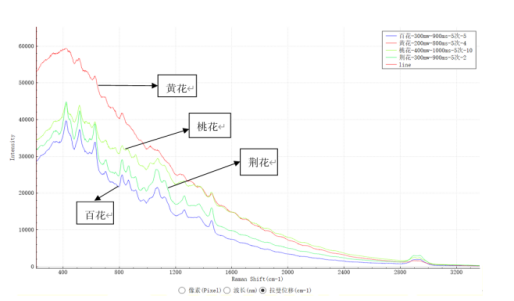
Fig. 3:4 primitive Raman spectra of honey from plants
As shown in figure 3, the fluorescence signal of honey is strong, which requires a long photobleaching process, usually about 1min. The fluorescence signal of dark-colored honey (yellow and peach blossoms) is stronger than that of light-colored honey (hundred flowers and bauhinia). The Raman spectra of honey show obvious characteristic peaks at 421,518,628,703,820,869,914,1070, 1125, 1262, 1369 and 1455cm-1. Referring to Qi Longkai's study [3], we can know that the Raman spectra of amides, amino acids, proteins, carbohydrates and other substances can be basically determined that honey contains proteins, amino acids, sugars and so on.
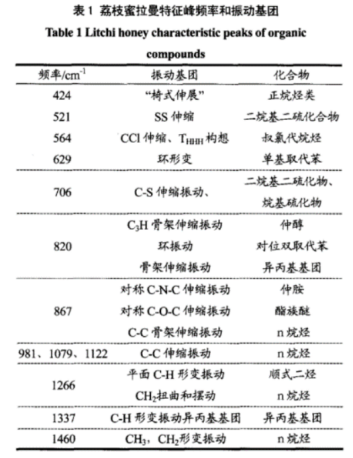
Study on the Spectral fingerprint of Litchi Milaman [3]
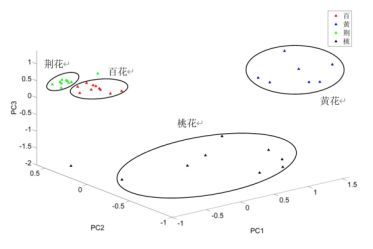
Figure 4:4 3D principal components map of honey from plant sources
The results of figure 4 show that the method of Raman spectroscopy combined with principal component analysis can distinguish honey from four different plant sources. Raman spectroscopy can directly and quickly identify the main components of honey, and the establishment of its fingerprint can provide a theoretical basis for honey identification and on-line quality control. In the study of OROIAN et al. [4], the accuracy of using PLS-LDA to classify the authenticity of honey is 96.54%, and it is found that this method is more suitable for detecting adulterated maltose syrup in honey. Raman spectroscopy can also be used to quantify adulterants in honey. WU et al combined Raman spectroscopy with CNN to identify adulterated honey samples such as high fructose syrup, rice syrup, malt syrup and mixed syrup.
Reference
[1]QIAO JT, CHEN LH, KONG LJ, et al. Characteristic components and authenticity evaluation of rape, acacia, and linden honey [J]. J Agric Food Chem, 2020, 68(36): 9776?9788.
[2]高西貝,杜欣玥,王琪琦,張根生.蜂蜜的真實性鑒別方法研究進展[J].食品安全質(zhì)量檢測學報,2022,13(18):5842-5848.DOI:10.19812/j.cnki.jfsq11-5956/ts.2022.18.038.
[3]祁龍凱,林勵,陳地靈,譚東山.荔枝蜜拉曼光譜指紋圖譜的研究[J].現(xiàn)代食品科技,2014,30(03):201-205.DOI:10.13982/j.mfst.1673-9078.2014.03.005.
[4] OROIAN M, ROPCIUC S, PADURET S. Honey adulteration detection using raman spectroscopy [J]. Food Anal Methods, 2018, 11(4): 959?968.
[5] WU XJ, XU BR, MA RQ, et al. Identification and quantification of adulterated honey by Raman spectroscopy combined with convolutional neural network and chemometrics [J]. Spectrochim Acta A, 2022, 274:
121?133.
4.Instrument recommendation
Product introduction
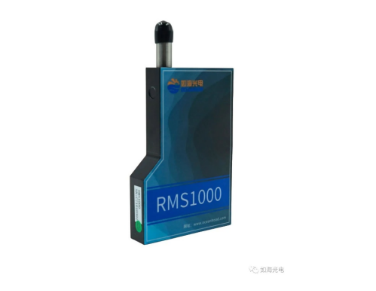
RMS1000 (RamanMinimalSystem) is a small 785nm Raman spectrometer, which integrates core components such as laser, Raman probe, fiber spectrometer and photodetector into a small, high-performance portable Raman spectrometer. It has excellent properties such as high sensitivity, high signal-to-noise ratio, wide spectral range and so on.
The whole machine configured with RMS1000 optical fiber spectrometer has the advantages of small size and light weight, and can be used alone. It can also be used as a hand-held, portable, box-type and other Raman spectrometer system, and can also be customized according to the needs of users. It can also provide special probes and sample supports for testing needs, which can fully meet the needs of scientific research institutes, relevant regulatory agencies and enterprises in inorganic / organic materials and biological life. Chemical / chemical, pharmaceutical analysis, food safety, criminal investigation and identification, environmental pollution detection and other research needs.
Product characteristics
lExcellent performance: high resolution, high sensitivity, high performance-to-noise ratio, etc.
l Non-destructive testing: direct testing in transparent or translucent packaging.
lLong-distance test: can be tested 1m away from the sample.
lPowerful software: compatible with a variety of operating systems, data acquisition, analysis, peer-to-peer.
l Easy to operate: friendly software interface, man-machine dialogue, simple operation.
l Multi-functional testing accessories: equipped with various optical fiber probes with large aperture collection efficiency, complete sets of optical fiber Raman microscopes, and can be equipped with a variety of sampling probes, including optical fiber Raman probes for remote testing, which can be applied to the detection of dangerous goods.
l Supports multi-system configuration: smaller size, can be connected to mobile phones, computers, etc., directly connected to direct mining, plug and play.
lCan be inserted directly into the microscope to do micro-Raman applications.
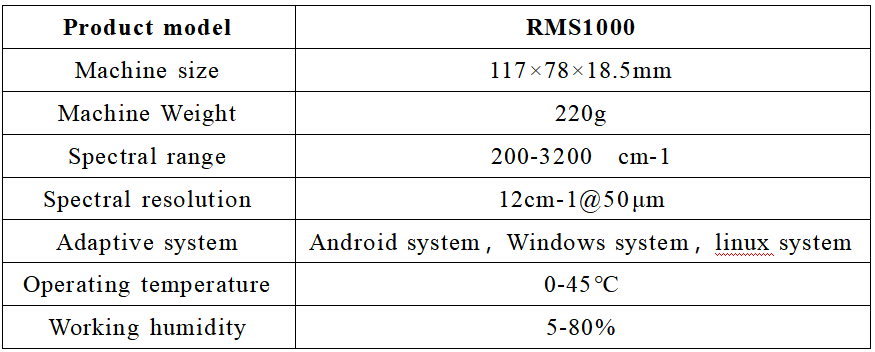
Specification parameters
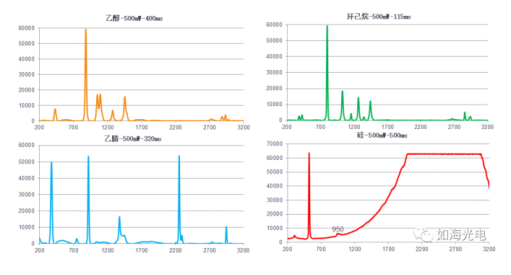
Typical spectrum
Penetration test experiment
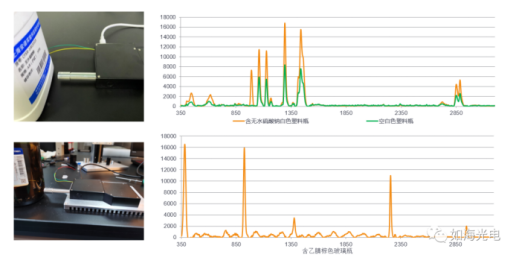
Check-out capability verification
