|
簡體中文|
English| Launch:2022-07-04 |
When light interacts with biological tissues, optical effects and phenomena such as reflection, absorption, fluorescence, and scattering (elastic scattering and inelastic scattering) occur. When an incident photon collides with a molecule inelastically, an energy exchange occurs between the photon and the molecule. Not only does the direction of movement of the photon change, but at the same time the photon transfers a part of the energy to the scattered molecule, which is converted into molecular vibration or rotational energy, or absorbs a part of the energy from the scattered molecule, resulting in a change in the wavelength/frequency of the photon. Raman shift is a physical quantity that characterizes the vibration and rotational energy level characteristics of molecules of a substance, and is also the basis for the analysis of the molecular structure of a substance using Raman spectroscopy.
The Raman spectrogram is rich in molecular fingerprint information, and the biochemical composition characteristics of the substance can be analyzed by the position of the Raman peak frequency shift. By comparing the Raman spectroscopic information of normal and diseased tissues, on the basis of faithfully reflecting the biochemical composition of tissues, it can not only be used to explore the pathogenesis and treatment mechanism, but also easier to achieve early quantitative diagnosis of major clinical malignant diseases. The selection of the appropriate wavelength of laser for spectral excitation of living biological tissues is particularly important for clinical spectral analysis measurements. Ultraviolet light irradiation can cause histochemical damage, visible light irradiation will stimulate strong tissue autofluorescence. Therefore, clinical Raman spectroscopy devices often use near-infrared light as excitation light. Compared with ultraviolet and visible light, near-infrared light has superior tissue penetration, which can achieve excitation of the tissue spectrum in a larger area. Moreover, low-power near-infrared light can produce less histochemical damage and autofluorescence.
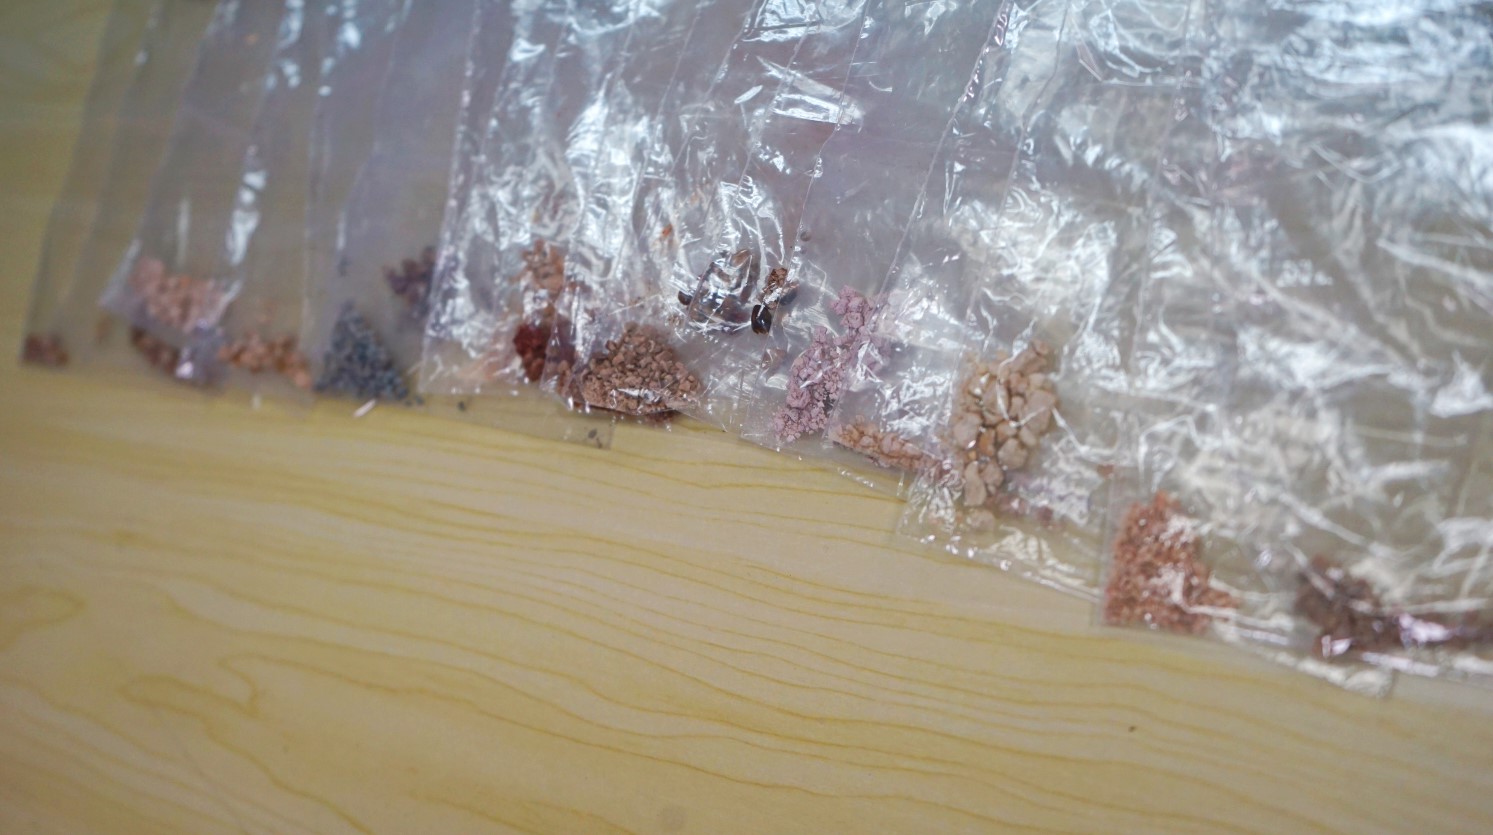
Fig.1 Experimental sample diagram
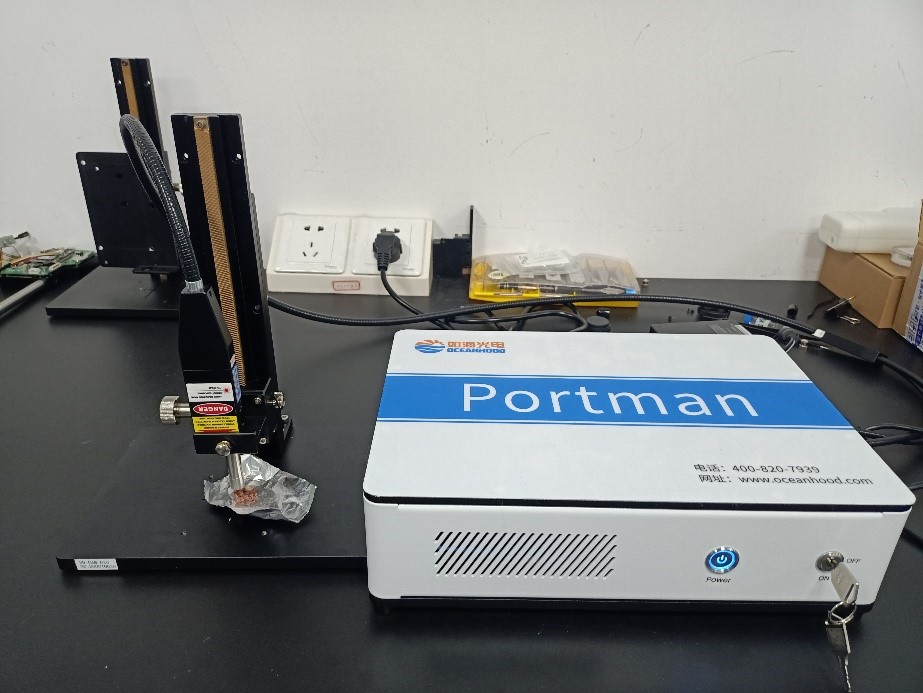
Fig.2 Raman spectroscopy acquisition
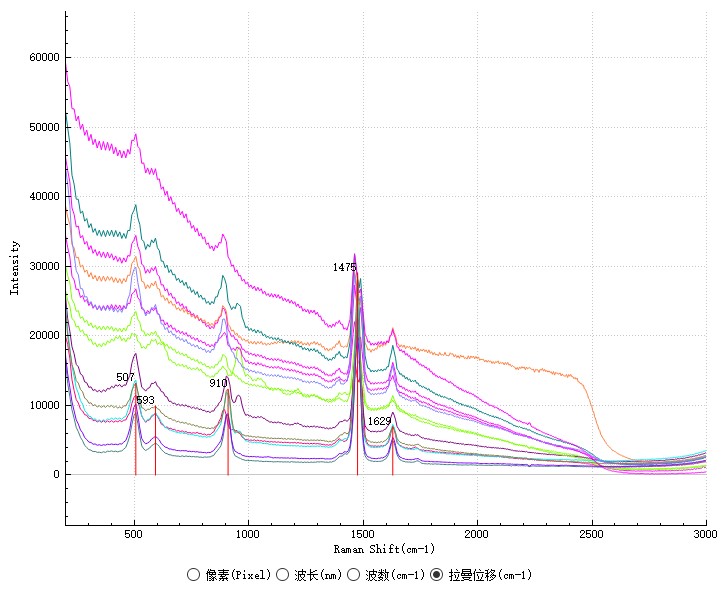
Fig.3 Raman spectra of 14 cases of stones
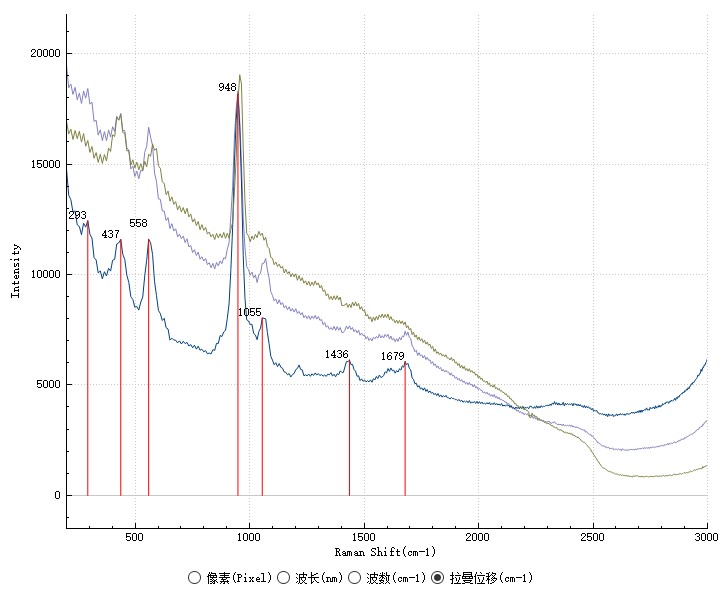
Fig.4 Raman spectra of 3 cases of stones
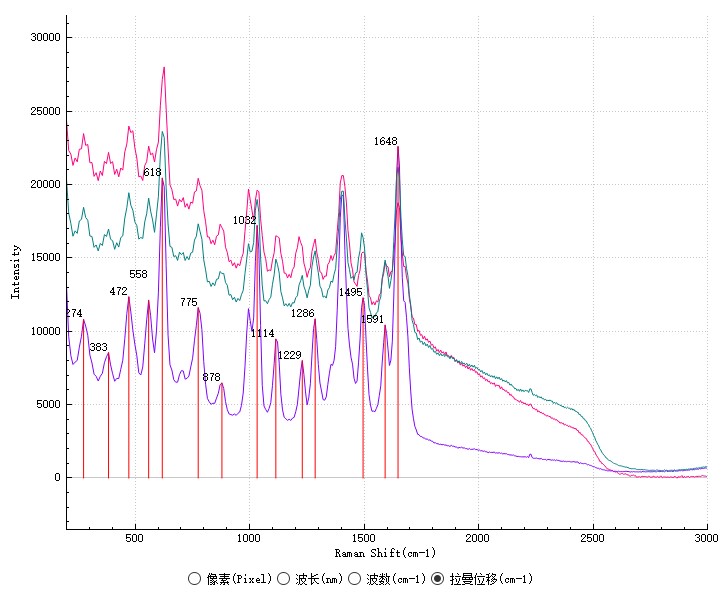
Fig.5 Raman spectra of 3 cases of stones
There are many factors influencing the formation and recurrence of stones, and the pathogenesis is not well understood. Most studies suggest that stone formation may be related to factors such as genetics, sex, age, race, climatic environment, dietary structure, and drinking habits. How to remove stones more safely and effectively, find factors related to stones, and delay the recurrence of stones as much as possible have become important goals for clinicians to continue to explore. The Raman spectra of 20 stone samples were collected, and by comparing with the standard library, it was known that 14 cases (Fig.3) were calcium oxalate, 3 cases (Fig.4) stones were calcium phosphate, and 3 cases (Fig.5) stones were uric acid. It shows that through raman spectroscopy, the purpose of differential diagnosis can be achieved, and a new method is created for the screening and diagnosis of clinical urine crystallization.
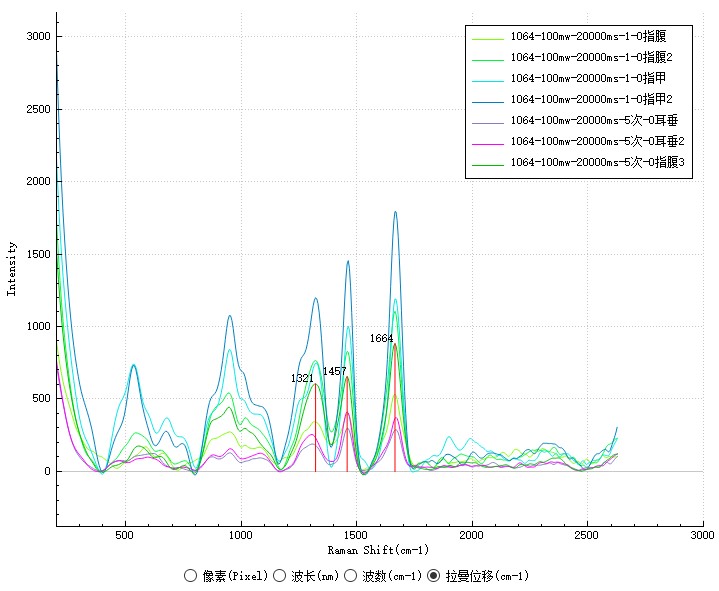
Fig.6 Raman spectroscopy of skin tissue
The skin is the largest organ of the human body, located in the outermost layer of the body, which has a protective effect on the human body, but long-term ultraviolet exposure can cause the skin to become cancerous. Skin cancers mainly include malignant melanoma and non-melanin skin cancers, the latter mainly including basal cell carcinoma and squamous cell carcinoma. During clinical Raman spectroscopy measurements, a handheld spectral probe receives a Raman signal perpendicular to the tissue/lesion surface. In general, each suspected lesion is measured once, but for lesions with uneven morphology, 3 times are measured at different locations inside it. In addition, spectral information of normal skin tissue in the 5 cm range near the lesion is measured simultaneously as a reference.
Fig.6 is the data of our physical and chemical colleagues' self-test, Raman spectroscopy can provide the skin's Raman characteristic peak information, can analyze the biochemical composition and structural characteristics of the tissue from the peak position, peak and other spectral characteristics. The analysis of a large number of Raman spectral data, combined with certain data statistical methods, processes multiple sets of Raman spectral data, and it is easier to obtain differentiated spectral characteristics of different types of biological tissues.
Ball D W Theory of Raman spectroscopy [J].Spectroscopy,2001,16(11):32-34
Patit C A,Pence I J, Lieber C A,et al.1064 nm dispersive Raman spectroscopy of tissues with strong near-infrared autofluorescence [J].Optics Letters, 2014 , 39(2): 303-306.

