|
簡體中文|
English| Launch:2022-06-28 |
Experimental methods
1)Weigh salicylic acid 13.88g, acetic anhydride 20.73g, sulfamic acid 0.25g; acetic anhydride, salicylic acid, in turn added 50mL three-mouth flask, magnetic stirring, water bath temperature rises to 60 °C, add sulfamic acid and start to collect spectra, every 1min to collect a reaction system Raman spectrum, 10min after heating to 80 °C, heat preservation reaction 30min. The sample spectra are saved as S1-41.
Among them, the spectral acquisition parameters are: laser power 400 mW, wavelength 785 nm, integration time 2000ms.
2)Pure acetylsalicylic acid (aspirin) 1 g was taken and the Raman spectroscopic data of pure substances were collected, and it was recorded as B1.
Among them, the spectral acquisition parameters are: laser power 400mW, wavelength 785 nm, integration time 2000ms.
Data analysis
1)Open the data processing platform (MATLAB2018b) and import the acquired reaction process spectra S1-S41 and B1;
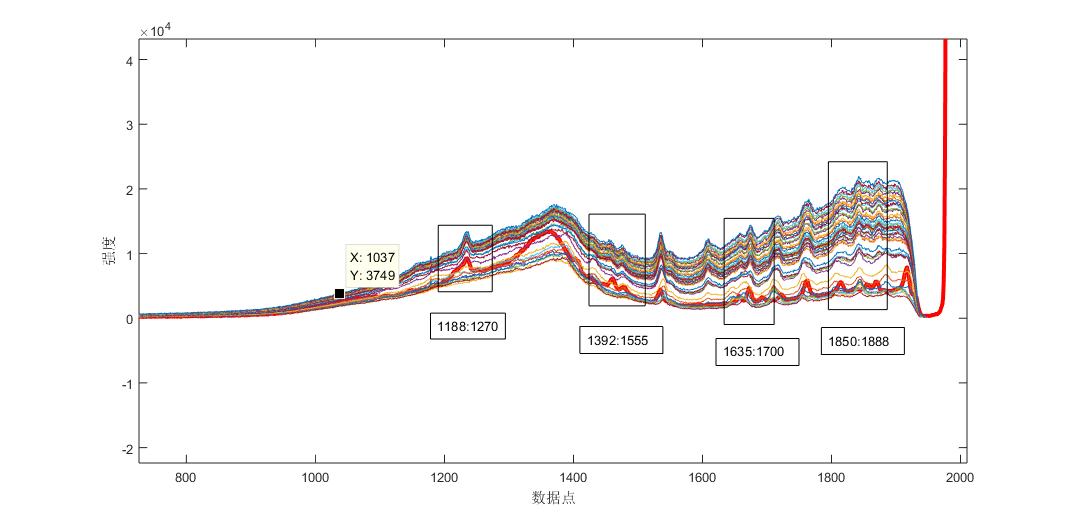
Fig. 1 Raman spectra of the reaction process of the control product aspirin with different times
2)The algorithm program is called to perform first-order conductive spectra pretreatment on S1-S18 and B1, and then the angle value of the reaction process spectrum S1-S41 and the pure spectrum B1 of aspirin is obtained;
3)The relationship between angle value and time was plotted, and the reaction trend of acetylsalicylic acid (aspirin) of the synthetic process product was obtained, and the reaction endpoint was judged. Fig. 2 shows the trend of the corresponding aspirin angle values in the samples at different reaction times.
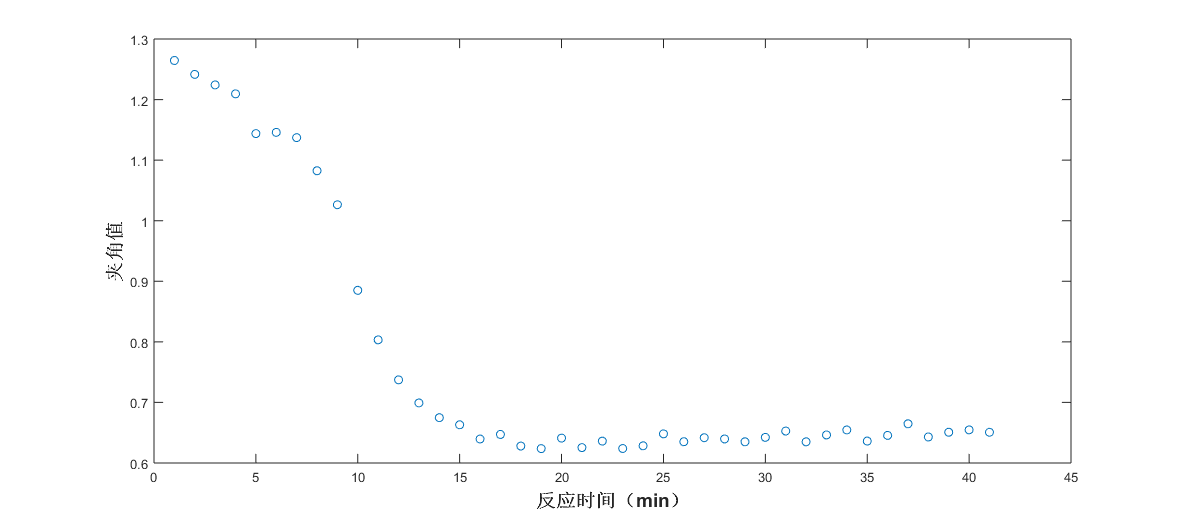
Fig. 2 Trend chart of angle values at different reaction times (aspirin)
As can be seen from the fig. 2, the angular value of the Raman spectral response of the system and the pure spectrum of aspirin tends to be flattened by the reaction to 15min, that is, the aspirin content of the product no longer increases, and the end point of the reaction is about 15min. Raman spectroscopy can be used to track the reaction trend of the aspirin synthesis process. Similarly, the other components of the system, acetic anhydride, salicylic acid, and acetic acid, were analyzed, and the results were shown in Fig. 3-8.
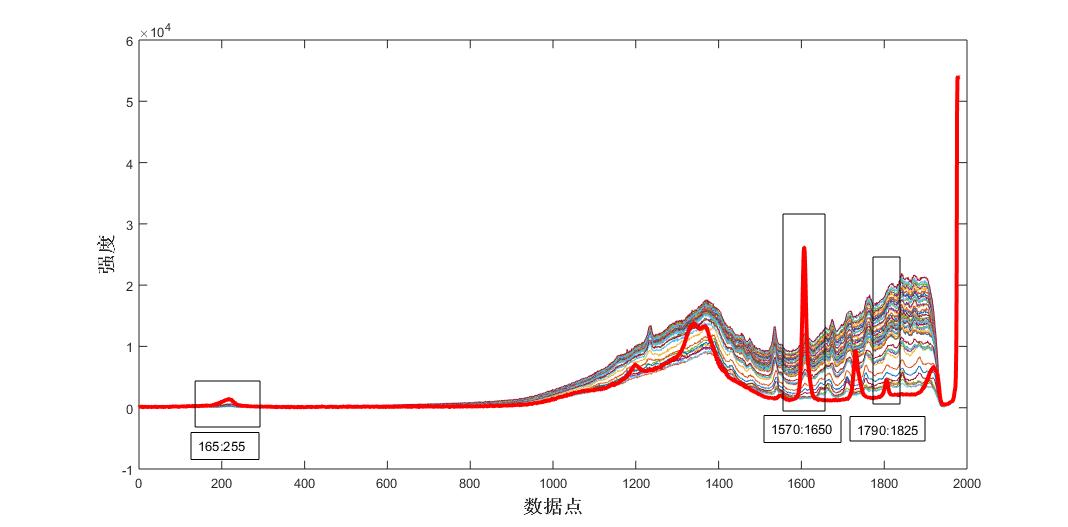
Fig. 3 Raman spectra of the reaction process of control acetic acid and different times
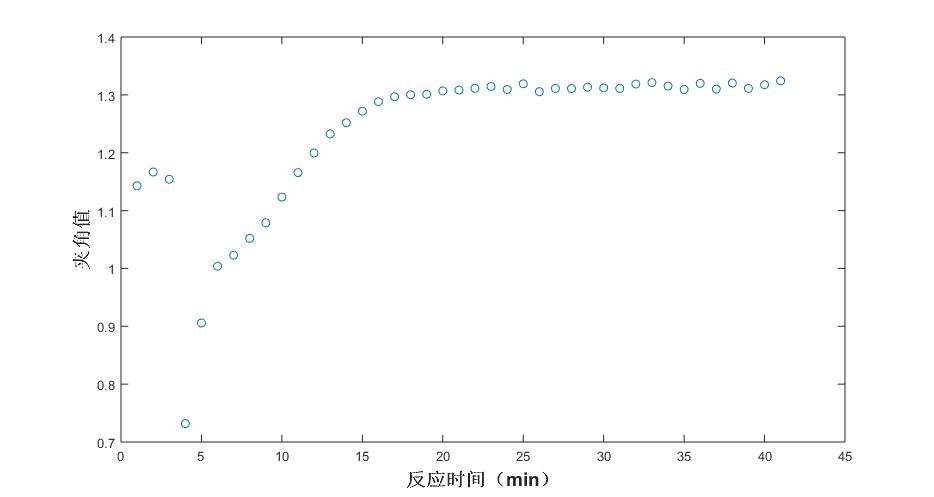
Fig. 4 Trend of angle values under different reaction times (acetic acid)
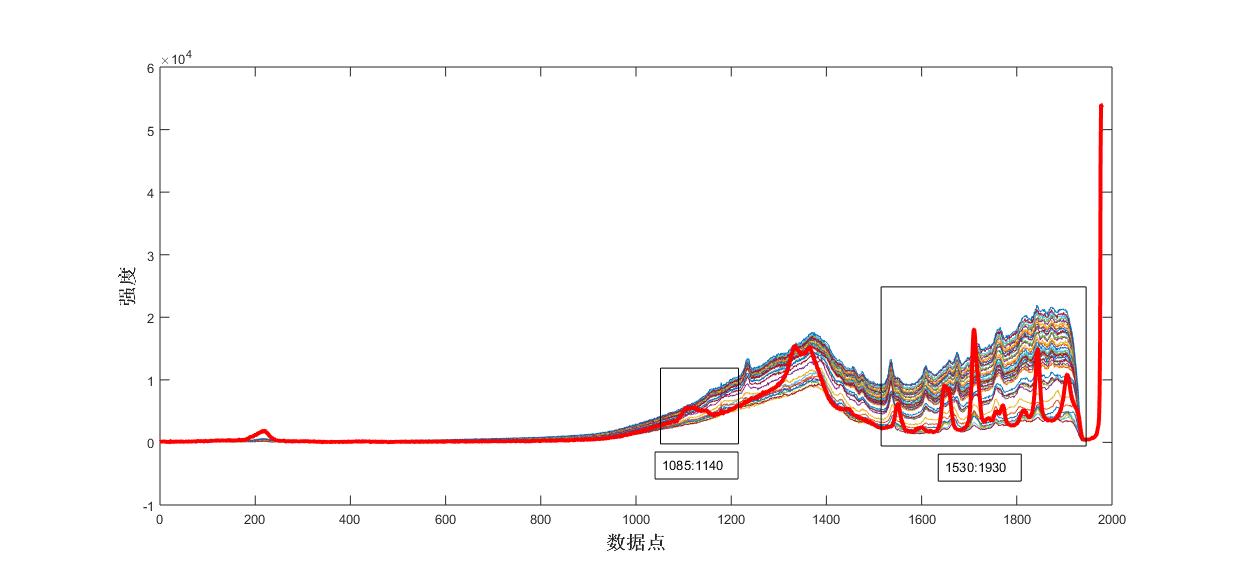
Fig. 5 Raman spectra of the reaction process of the control product
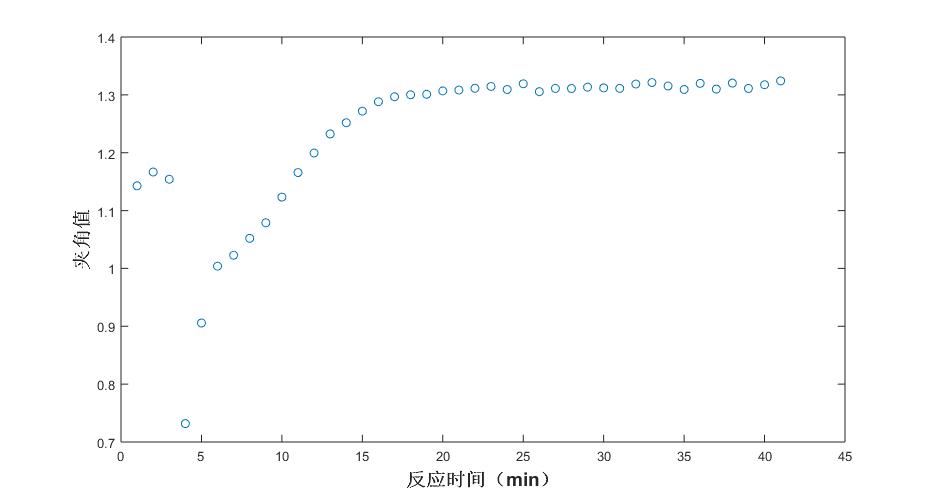
Fig. 6 Trend of angle values under different reaction times (salicylic acid)
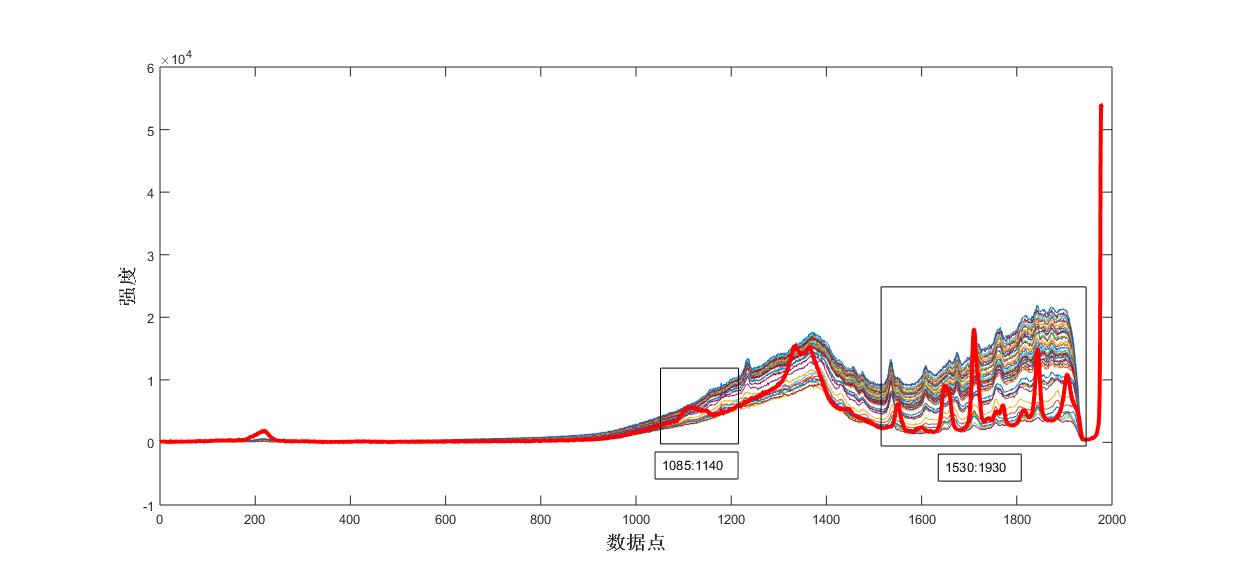
Fig. 7 Raman spectra of the reaction process of the control acetic
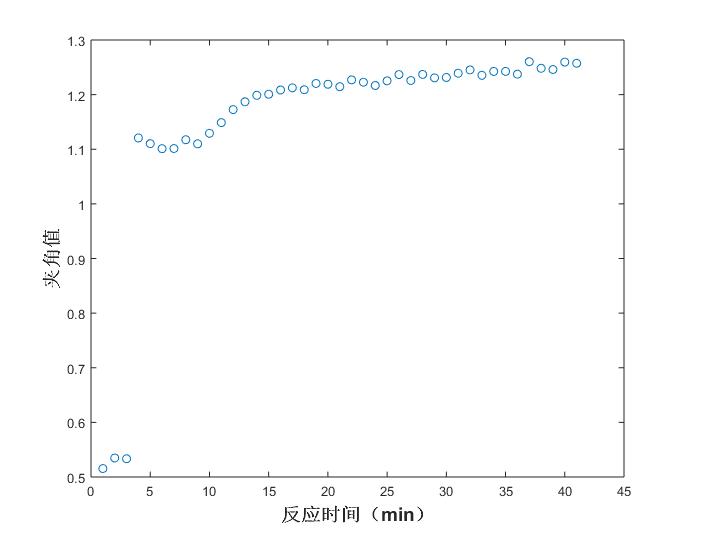
Fig. 8 Trend of angle values at different reaction times (acetic anhydride)
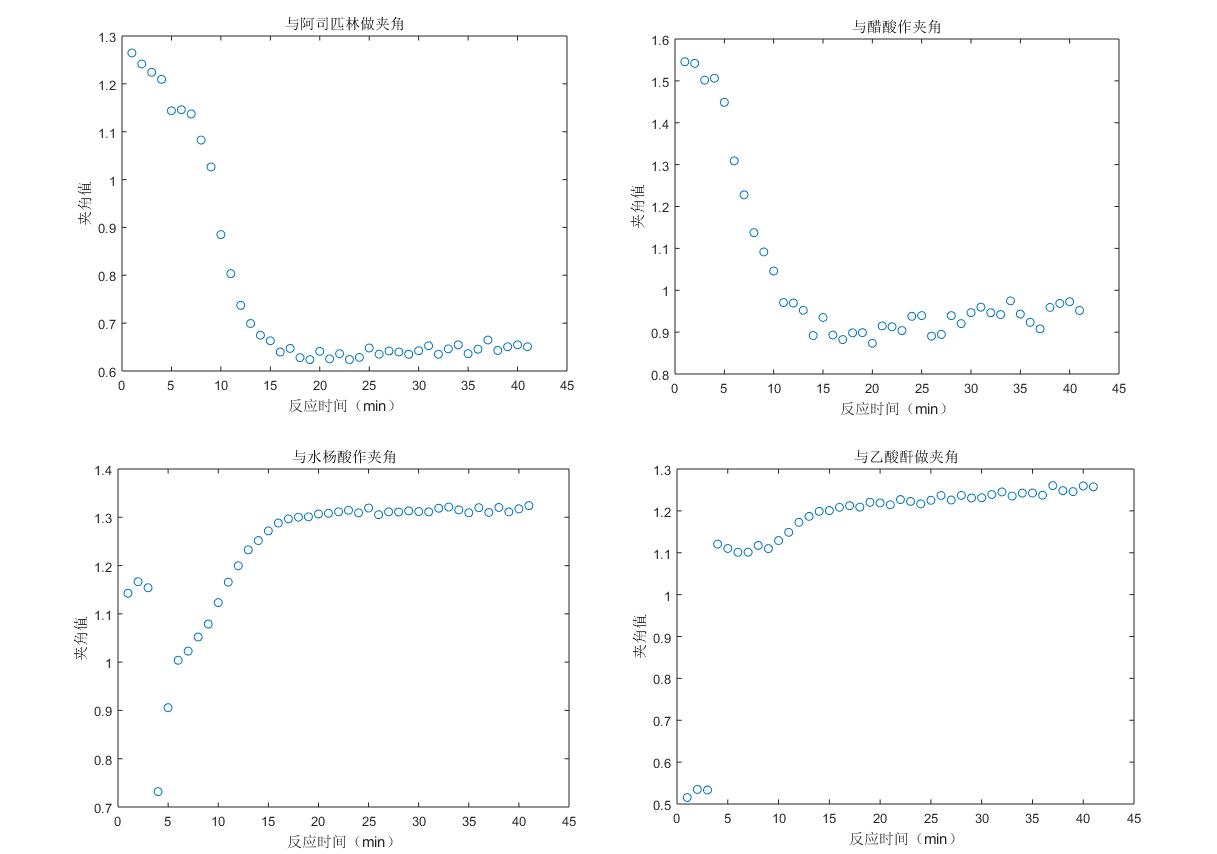
Fig. 9 Reaction trend graph of the four components of the system
The first three points are abnormal because the reaction has not started, the reactants are in a dissolved state, and the formal reaction begins from the fourth point; the 4th, 5th, 6th, and 7th points of the acetic anhydride trend chart are upturned because of some equilibrium reached with acetic acid in the reaction; at about 15 minutes, the reaction is completed.
Conclusion
The trend chart of both the angle with the generator and the reactant is consistent with the actual reaction, indicating that the real-time tracking of the synthetic aspirin reaction process can be completed by using the Raman geometric space angle method.

